What is CRISP-DM?
At some point working in data science, it is common to come across CRISP-DM. I like to irreverently call it the Crispy Process. It is an old concept for data science that’s been around since the mid-1990s. This post is meant as a practical guide to CRISP-DM.
CRISP-DM stands for CRoss Industry Standard Process for Data Mining. The process model spans six phases meant to fully describe the data science life cycle.
- Business understanding
- Data understanding
- Data preparation
- Modeling
- Evaluation
- Deployment
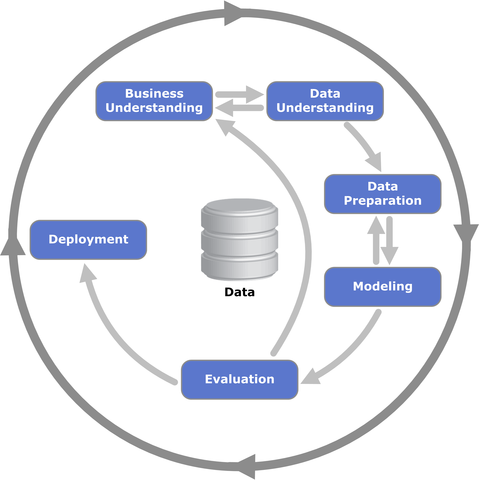
This cycle comes off as an abstract process with little meaning if it cannot be grounded into some sort of practical example. That’s what this post is meant to be. The following is going to take a casual scenario appropriate for many Midwestern gardeners about this time of year.
What am I planting in my backyard this year?
It is a vague, urgent question reminiscent of many data science client problems. In order to do that we’re going to use the Crispy Process in this practical guide to CRISP-DM.
First, we need a “Business understanding”. What does the business (or in this case, gardener) need to know?
Next, we have to form “Data understanding”. So, what data is going to cover our first needs? What format do we need that data in?
With our data found, we need to do “Data preparation”. The data has to be organized and formatted so it can actually be used for whatever analysis we’re going to use for it.
The fourth phase is the sexy bit of data science, “Modeling”. There’s information in those hills! Er…data. But we need to apply algorithms to extract that information. I personally find the conventional title of this fifth phase to be somewhat confusing in contemporary data science. Colloquial conversations I would have among fellow data professionals wouldn’t use “Modeling” but rather “Algorithm Design” for this part.
“Evaluation” time. We have information As one of my former team leads would ask at this stage, “You have the what. So what?”
Now that you have something, it needs to be shared with the “Deployment” stage. Don’t ignore the importance of this stage!
I pick up on who is a new professional and who is a veteran by how they feel about this part of a project. Newbies have put so much energy into Modeling and Evaluation, Deployment is like an afterthought. Stop! It’s a trap!
For the rest of us “Deployment” might as well be “What we’re actually being paid for”. I cannot stress enough that all the hours, sweat, and frustration of the previous phases will be for nothing if you do not get this part right.
Business understanding: What does the business need to know?
We have a basic question from our gardener.
What am I planting in my backyard this year?
To get a full understanding of what they need though in order to take action as a gardener to plant their backyard this year, we need to break this question down into more specific concrete questions.
If I ever can, I want to learn as much about the context of the client. This does necessarily mean I want them to answer “What data do you want?” It is also important to keep a client steered away from preconceived notions of the end result of the project. Hypothesizes can dangerously turn into premature predictions and disappointment when reality does not match those expectations.
Rather, it is important to appreciate what kind of piece you’re creating for the greater puzzle your client is putting together.
About the client
I am a Midwestern gardener myself so I’m going to be my own customer.
Gardening hobbyist who wants to understand the plants best suited for a given environment. Ideal environment to include would be the American Midwest, the client’s location. Their favorite color is red and they like the idea of bits of showy red in their backyard. Anything that is low maintenance is a plus.
For this client, they would prefer the ability to keep the data simple and shareable to other hobbyists. Whatever data, we get should be verified for what it does and does not have as the client is skeptical of a dataset’s true objectivity.
Data understanding: What data is going to cover our needs?
One trick I use to try to objectively break down complex scenarios in real life is to sift the business problem for distinct entities and use those to push my data requirements.
We can infer from the scenario that the minimal amount of entities are the gardener and the plant. As the gardener is presumably a hobbyist and probably doesn’t have something like a greenhouse at their disposal, we can also presume that their backyard is another major entity, which is made of dirt and is a location. It is outside, so other entities at play include the weather. That is also dependent on location. Additionally, the client cares about a plant’s hardiness and color.
So we know we have the following issues at least to address:
- Gardener
- Plant
- Location
- Dirt
- Weather
- Plant Hardiness
- Plant Color
The Gardener is our client and is seeking to gain knowledge about what is outside their person. So we can discard them as an essential data point.
The plant can be anything. It is also the core of our client question. We should find data that is plant-centric for sure.
Location is essential because that can dictate the other entities I’m considering like Dirt and Weather. Our data should help us figure out these kinds of environmental factors.
Additionally, we need to find data that could help us find the color and hardiness of a plant.
There are many datasets for plants, especially for the US and UK. Our client is American so American-focused datasets will narrow our search.
The USDA has a robust plant database as seen in the screenshot below. It includes locations where the plants are best suited, which is incredibly useful. We can get information on plant uses, its history, and management. 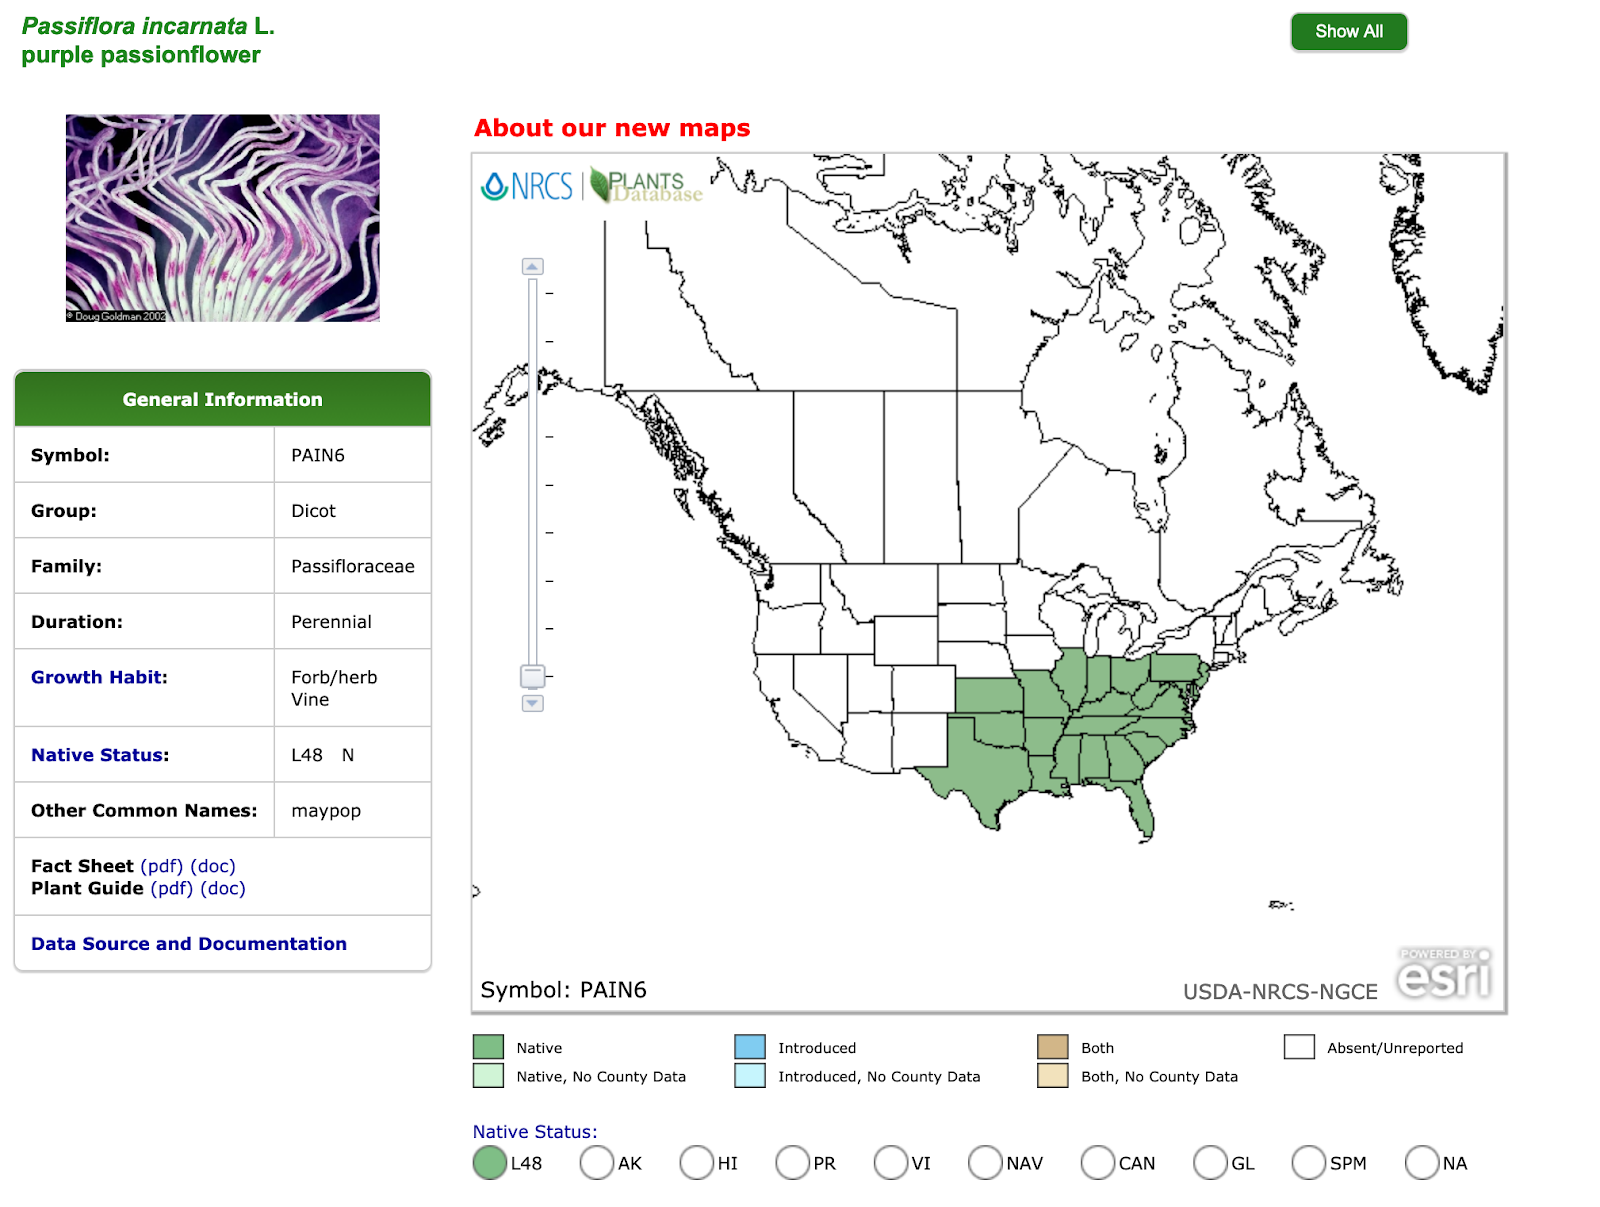
It has several issues though with our needs. One of the most glaring ones is location. While it does have state information, single states in the United States can be larger than one country in many parts of the world. They can cover large geography types so our concern about issues like weather are not accounted for in this dataset.
Perhaps ironically, the USDA does have a measuring system for handling geographically-based plant growing environments, the USDA Plant Hardiness Zones.
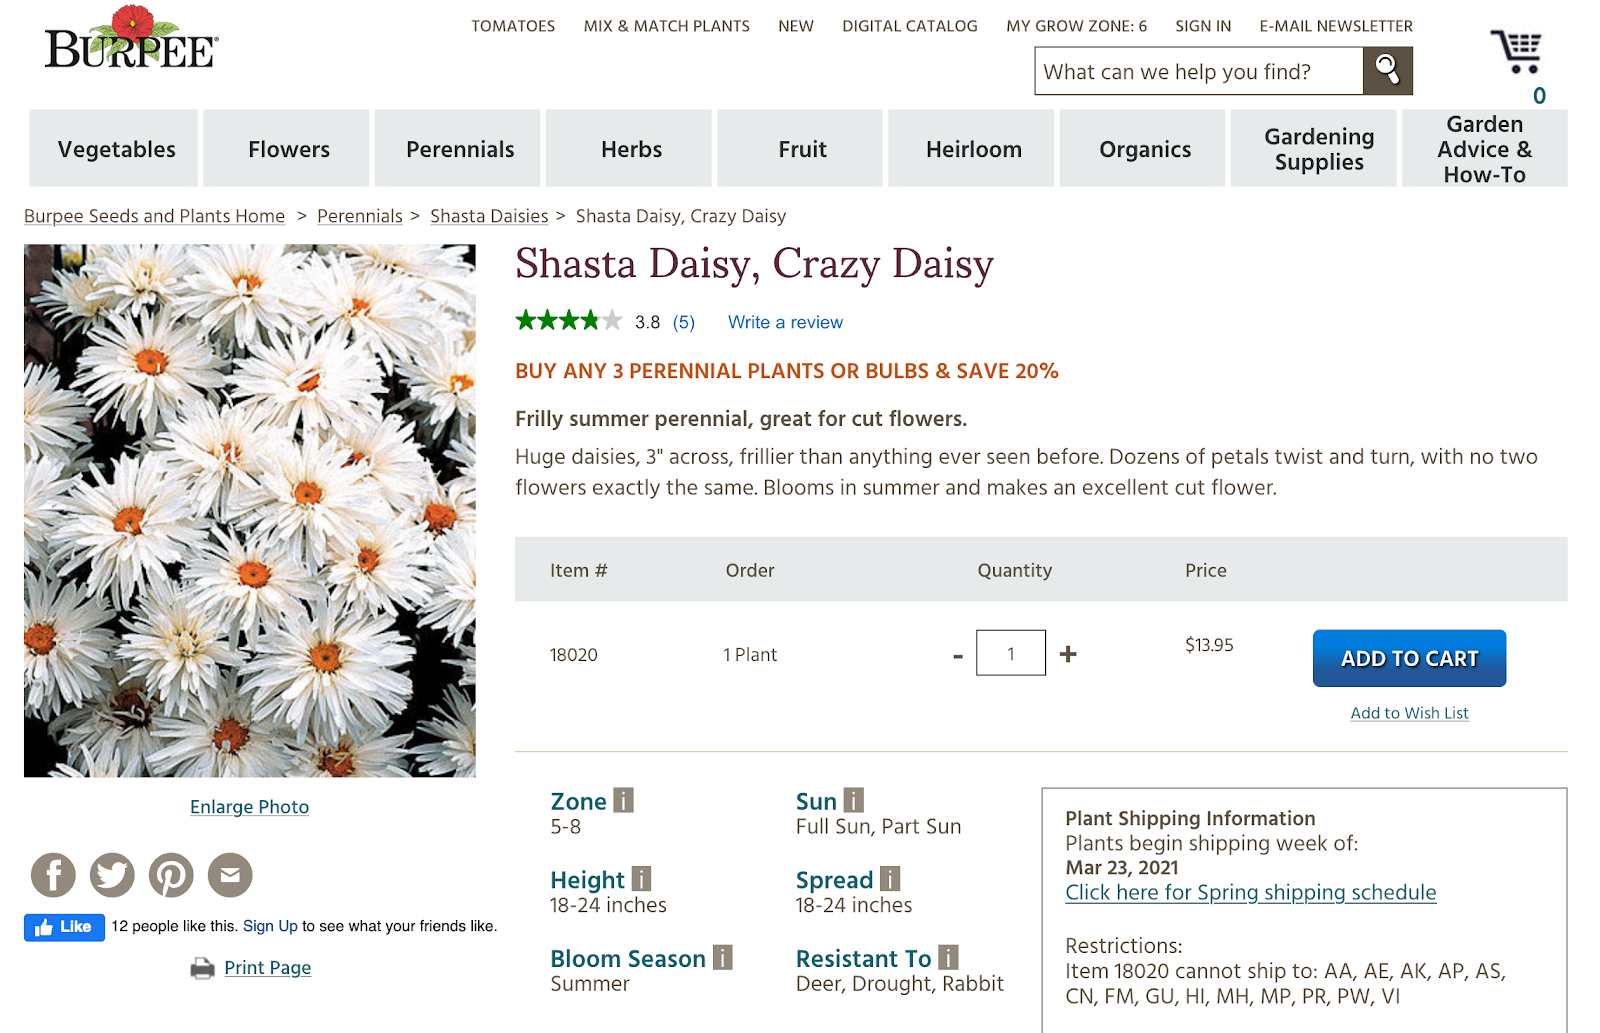
USDA Plant Hardiness Zones are so prevalent, they are what Americans gardeners typically used to shop for plants. Given that our client is an American gardener, it is going to be important to grab that information. Below is an example of an American plant store describing the hardiness zone for the plant listed.
American institutions dedicated to plants and agriculture are not limited to just the federal government. In the Midwest, the Missouri Botanical Garden has its own plant database, which shows great promise.
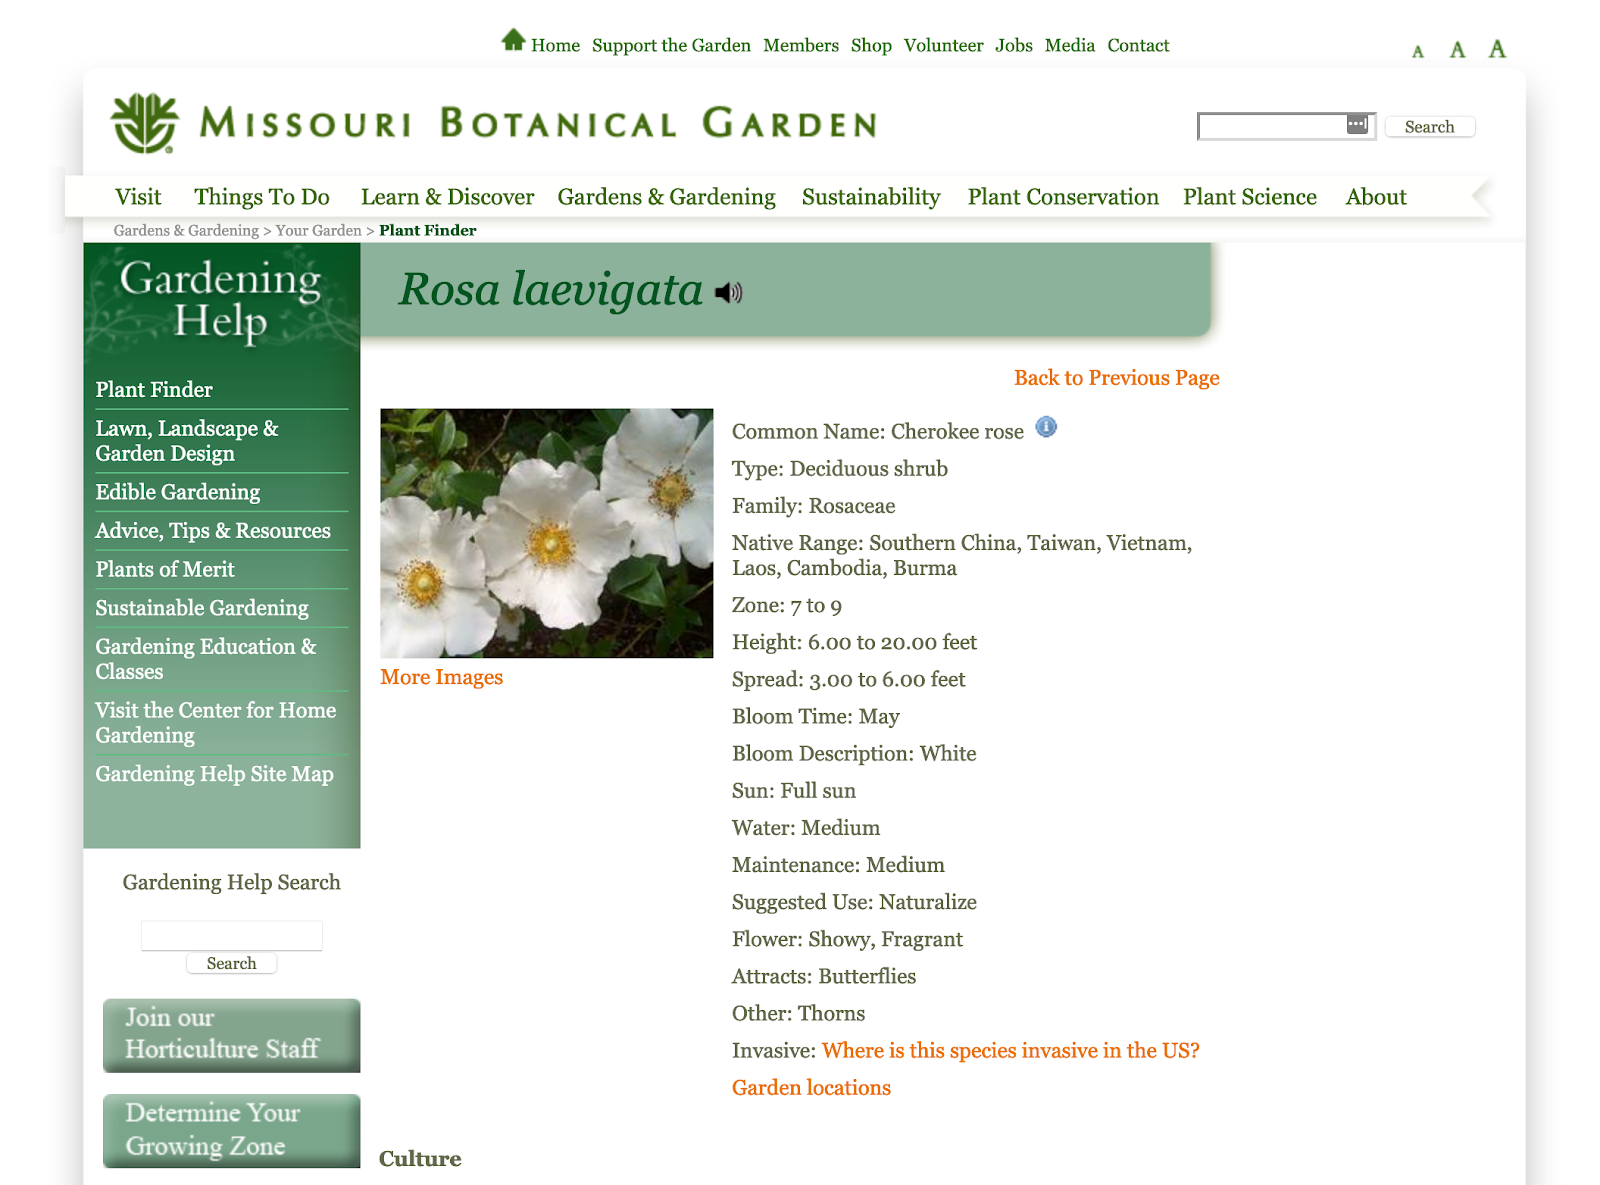
Not only does it have hardiness zones, it also has data to evaluate water needs, and a color-based bloom description. Additional searching through the data also allows us to consider the dirt quality it tolerates as well as other extreme scenarios like drought.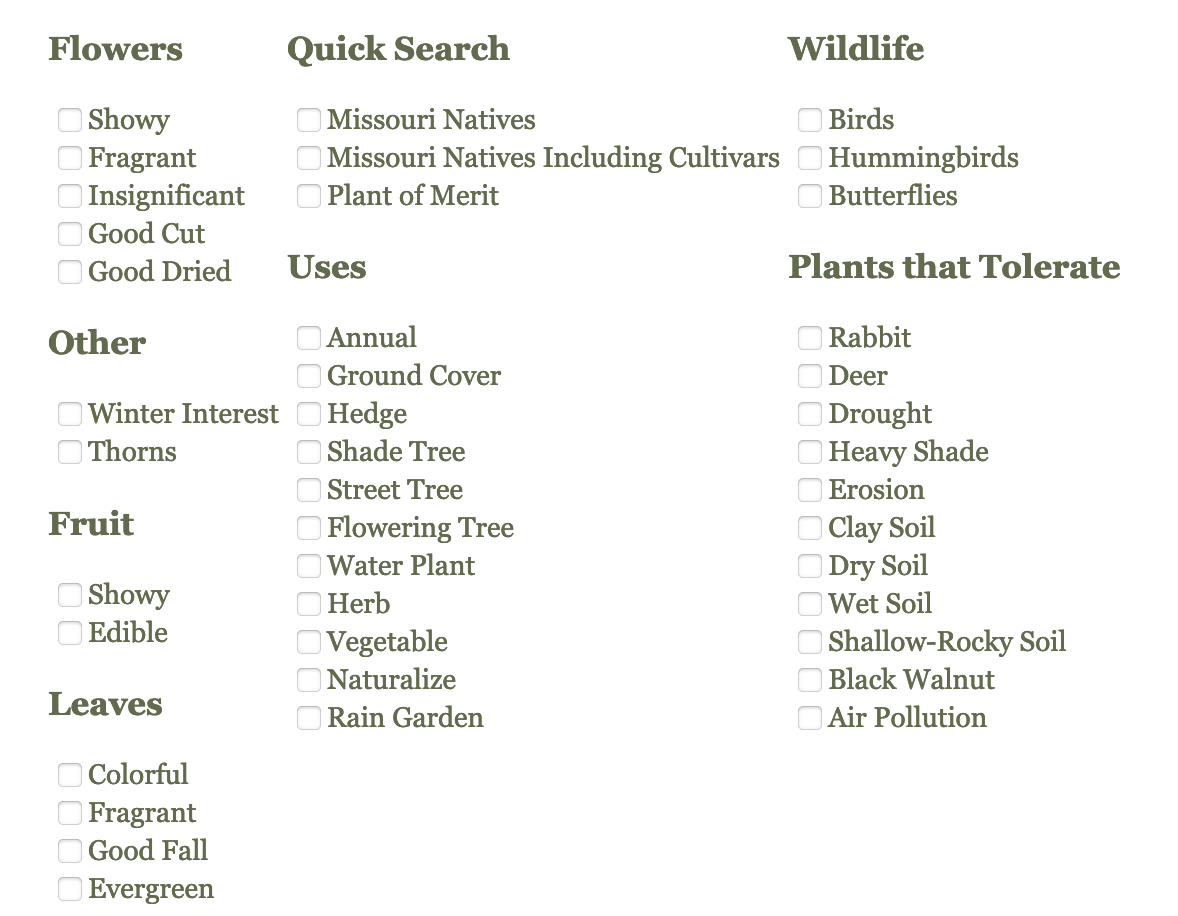
The way the current data is set up, we could send this on to our client, but we have no way of helping them verify exactly what this dataset does and does not have. We only know what it could have (drought-resistant, flowering, etc), but not how many entries.
We’re going to have to extract this data out of MOBOT’s website and into a format we can explore in something like a Jupyter notebook.
Data preparation: How does the data need to be formatted?
Getting the Data
The clearest first step is that we need to get that data out of just MOBOT’s website.
Using Python, this is a straightforward process using the popular library, Beautiful Soup. The following presumes you are using some version of Python 3.x.
The first function we want to approach this is a systematic way of crawling all the individual webpages with plant entries. Luckily, for every letter in the Latin alphabet, MOBOT has web pages that use the following URL pattern:
https://www.missouribotanicalgarden.org/PlantFinder/PlantFinderListResults.aspx?letter=<LETTER>
So for every letter in the Latin alphabet, we can loop through all the links in all the webpages we need.
The following is how I tackled this need. To just go straight to the code, follow this link.
def find_mobot_links():
alphabet_list = [“A”, “B”, “C”, “D”, “E”, “F”, “G”, “H”, “I”, “J”, “K”, “L”, “M”, “N”, “O”, “P”, “Q”, “R”, “S”, “T”, “U”, “V”, “W”, “X”, “Y”, “Z”]
for letter in alphabet_list:
file_name = “link_list_” + letter + “.csv”
g = open(“mobot_entries/” + file_name, ‘w’)
url = “https://www.missouribotanicalgarden.org/PlantFinder/PlantFinderListResults.aspx?letter=” + letter
page = requests.get(url)
soup = BeautifulSoup(page.content, ‘html.parser’)
for link in soup.findAll(‘a’, id=lambda x: x and x.startswith(“MainContentPlaceHolder_SearchResultsList_TaxonName_”)):
g.write(link.get(‘href’) + “\n”)
g.close()
Now that we have the links we know we need, let’s visit them and extract data from them. Web page scraping is a process of trial and error. Web pages are diverse and often change. The following grabbed the data I needed and wanted from MOBOT but things can always change.
def scrape_and_save_mobot_links():
alphabet_list = [“A”, “B”, “C”, “D”, “E”, “F”, “G”, “H”, “I”, “J”, “K”, “L”, “M”, “N”, “O”, “P”, “Q”, “R”, “S”, “T”, “U”, “V”, “W”, “X”, “Y”, “Z”]
for letter in alphabet_list:
file_name = “link_list_” + letter + “.csv”
with open(“./mobot_entries/” + file_name, ‘r’) as f:
for link_path in f:
url = “https://www.missouribotanicalgarden.org” + link_path
html_page = requests.get(url)
http_encoding = html_page.encoding if ‘charset’ in html_page.headers.get(‘content-type’, ”).lower() else None
html_encoding = EncodingDetector.find_declared_encoding(html_page.content, is_html=True)
encoding = html_encoding or http_encoding
soup = BeautifulSoup(html_page.content, from_encoding=encoding)
file_name = str(soup.title.string).replace(” – Plant Finder”, “”)
file_name = re.sub(r’\W+’, ”, file_name)
g = open(“mobot_entries/scraped_results/” + file_name + “.txt”, ‘w’)
g.write(str(soup.title.string).replace(” – Plant Finder”, “”) + “\n”)
g.write(str(soup.find(“div”, {“class”: “row”})))
g.close()
print(“finished ” + file_name)
f.close()
time.sleep( 5 )
Side note: A small, basic courtesy is to avoid overloading websites serving the common good like MOBOT with a barrage of activity. That is why the timer is used in between every loop.
Transforming the Data
With the data out and in our hands, we still need to bring it together in one convenient file, we can examine all at once using another Python library like pandas. The method is relatively straightforward and also already on Github if you would like to just jump in here .
Because our previous step got us almost everything we could possibly get from MOBOT’s Plant Finder, we can pick and choose just what columns we really want to deal with in a simple, flat csv file. You may notice the code allows for the near constant instances where a data column we want to fill in doesn’t have a value from a given plant. We just have to work with what we have.
Ultimately, the code pulls Attracts, Bloom Description, Bloom Time, Common Name, Culture, Family, Flower, Formal Name, Fruit, Garden Uses, Height, Invasive, Leaf, Maintenance, Native Range, Noteworthy Characteristics, Other, Problems, Spread, Suggested Use, Sun, Tolerate, Type, Water, and Zone.
That should get us somewhere!
Modeling: How are we extracting information out of the data?
I am afraid there isn’t going to be anything fancy happening here. I do not like doing anything complicated when it can be straightforward. In this case, we can be very straightforward. For the entirity of my data anlsysi process, I encourage you to go over to my Jupyter Notebook here for more: https://github.com/prairie-cybrarian/mobot_plant_finder/blob/master/learn_da_mobot.ipynb
The most important part is the results of our extracted information:
- Chinese Lilac (Syringa chinensis Red Rothomagensis)
- Common Lilac (Syringa vulgaris Charles Joly)
- Peony (Paeonia Zhu Sha Pan CINNABAR RED)
- Butterfly Bush (Buddleja davidii Monum PETITE PLUM)
- Butterfly Bush (Buddleja davidii PIIBDII FIRST EDITIONS FUNKY …)
- Blanket Flower (Gaillardia Tizzy)
- Coneflower (Echinacea Emily Saul BIG SKY AFTER MIDNIGHT)
- Miscellaneous Tulip (Tulipa Little Beauty)
- Coneflower (Echinacea Meteor Red)
- Blanket Flower (Gaillardia Frenzy)
- Lily (Lilium Barbaresco)
Additionally, we have a simple csv we can hand over to the client. I will admit as far as clients go, I am easy. Almost like I can read my mind.
Evaluation: You have the what. So what?
In some cases, this step is simply done. We have answered the client’s question. We have addressed the client’s needs.
Yet, we can still probably do a little more. In the hands of a solid sales team, this is the time for the upsell. Otherwise, we are in scope-creep territory.
Since I have a good relationship with my client (me), I’m going to at least suggest the following next steps.
Things you can now do with these new answers:
- Cross reference soil preferences of our listed flowers with the actual location of the garden using the USDA Soil Survey’ data (https://websoilsurvey.sc.egov.usda.gov/App/HomePage.htm).
- Identify potential consumer needs of the client in order to find and suggest seed or plant sources for them to purchase the listed flowers.
Deployment: Make your findings known
Person experience has shown me that deployment is largely an exercise in client empathy. Final delivery can look like so many things. Maybe it is a giant blog post. Maybe it is a PDF or a PowerPoint. So long as you deliver in a format that works for your user, it does not matter. All that matters is that it works.
